


My name is Neil Darragh PhD. I am a freelance Data Scientist based in Edinburgh, Scotland.


Note: The finished dashboard for this project can be seen here.
There are some markets that we only interact with occasionally in our lifetimes. For many of us, buying a home is one of those markets. In the US, where I lived for many years, it is quite typical when buying a property to hire a Buyers Agent – A Realtor who knows the market in which you are considering buying, can understand what you’re looking for and can search listings with that knowledge and find properties of interest. Of course, you pay for this knowledge but not usually directly – the sellers typically pay their Selling Realtor to sell their home and the Selling Realtor will split their commission (typically around 6%) with the Buyers Realtor on some basis (often 50/50). Great for the buyer but kind of sucks for the seller who has to fork out all that commission when the property sells.
Note: The finished dashboard for this project can be seen here.
In the post for part 1 of this project we explained the motivation behind it and the database schema that we’re going to be using to analyse the market. In part 2 we are going to start performing some exploratory data analysis and build some additional features which will help us understand the market.
As many Data Scientists do, I do much of my exploratory work using Jupyter Notebook. The rest of this post is a Jupyter Notebook where I am sharing the code and the results together.
Note: The finished dashboard for this project can be seen here.
In part 1 and part 2 of this project we looked at the motivation for the project, the database schema, data preparation and some initial exploratory data analysis to get a feel for the overall market. Now, as we know intuitively, the market for property is strongly affected by location. In this post we’re going to develop visualisations for the data that allow us to easily see and understand this aspect of the market. Once again, we will switch to Jupyter Notebook to develop the visualisations.
Note: The finished dashboard for this project can be seen here.
So far we’ve built up some basic understanding of the overall market and made some visualisations that allow us to peruse the properties for sale by geo-location. That’s all good but not much, if anything, more than what you can do on most of the listings sites. What we want to do now is start developing insights that you can’t see on those sites with the aim of identifying value vs price.
Note: The finished dashboard for this project can be seen here.
So far we’ve been concerned with providing tools to explore the data and provide analysis. We now turn to another popular aspect of data science: machine learning and inference.
We’ve seen in the data (and we know this intuitively) that there are factors that strongly correlate with the price of a home – how many bedrooms it has, how many bathrooms (which is likely to be highly correlated) and where it is located, to name just a few. Indeed, using the analysis we’ve already done, one could make a pretty reasonable guess at the value of a generic flat, for example, just by knowing how many bedrooms it has and in which postcode sector it is located. We could perhaps make it a bit more sophisticated by adding in an ‘adjustment factor’ for how many bathrooms it has. However, once the number of factors gets beyond just a handful of ‘adjustment factors’, the model becomes quite complex and unwieldy and likely, inaccurate, as the shaky assumptions we made about the relationships between the factors is exposed.
This is where the power of machine learning comes in – a rich set of tools for building data models from existing data and which we can then use to infer values for new data we have never seen before.

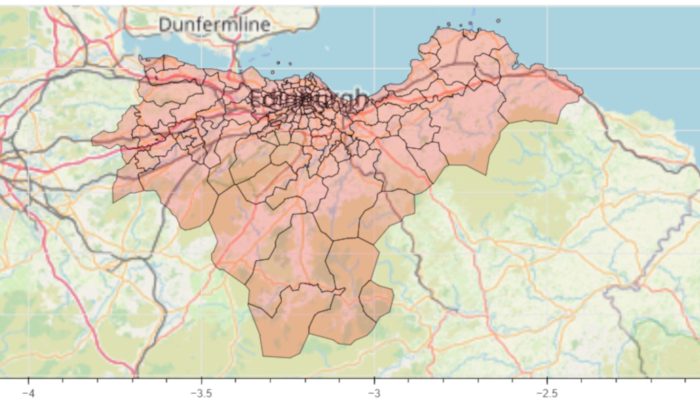
In this tutorial I’m going to show how you can overlay UK postcode sectors onto a map. I recently had to do this for the project: A Data Scientist goes…House Hunting. There are always difficulties to overcome, and in this project, package incompatibility was certainly a serious obstacle. However, once this was fully understood, I developed a method which consolidates the necessary components. This allowed me to render a map with the overlay. I also implemented a cool hover tool that enables the user to interact with the map.
My name is Neil Darragh PhD. I am a freelance Data Scientist based in Edinburgh, Scotland.