A Data Scientist goes…House Hunting (Part 3 – Geo-Location Visualisation)
Note: The finished dashboard for this project can be seen here.
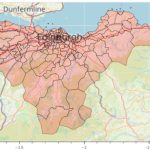
In part 1 and part 2 of this project we looked at the motivation for the project, the database schema, data preparation and some initial exploratory data analysis to get a feel for the overall market. Now, as we know intuitively, the market for property is strongly affected by location. In this post we’re going to develop visualisations for the data that allow us to easily see and understand this aspect of the market. Once again, we will switch to Jupyter Notebook to develop the visualisations.
You may also like